MUI X Data GridCustom table featuresLeafletPlaywrightMock APINext.jsTypescriptTailwind CSSResponsive Layout
A data management platform that extends MUI Table with tree structures, visual budget indicators, and interactive maps to simplify campaign analysis.
 Project Highlights
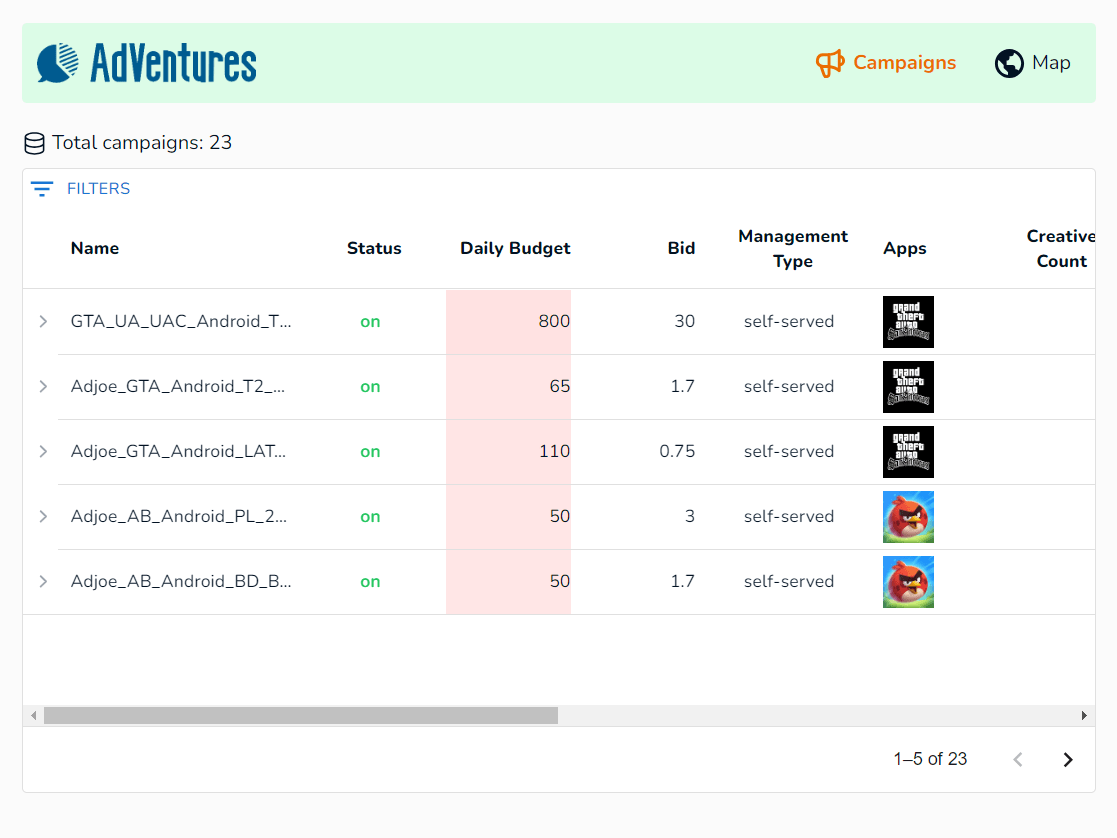
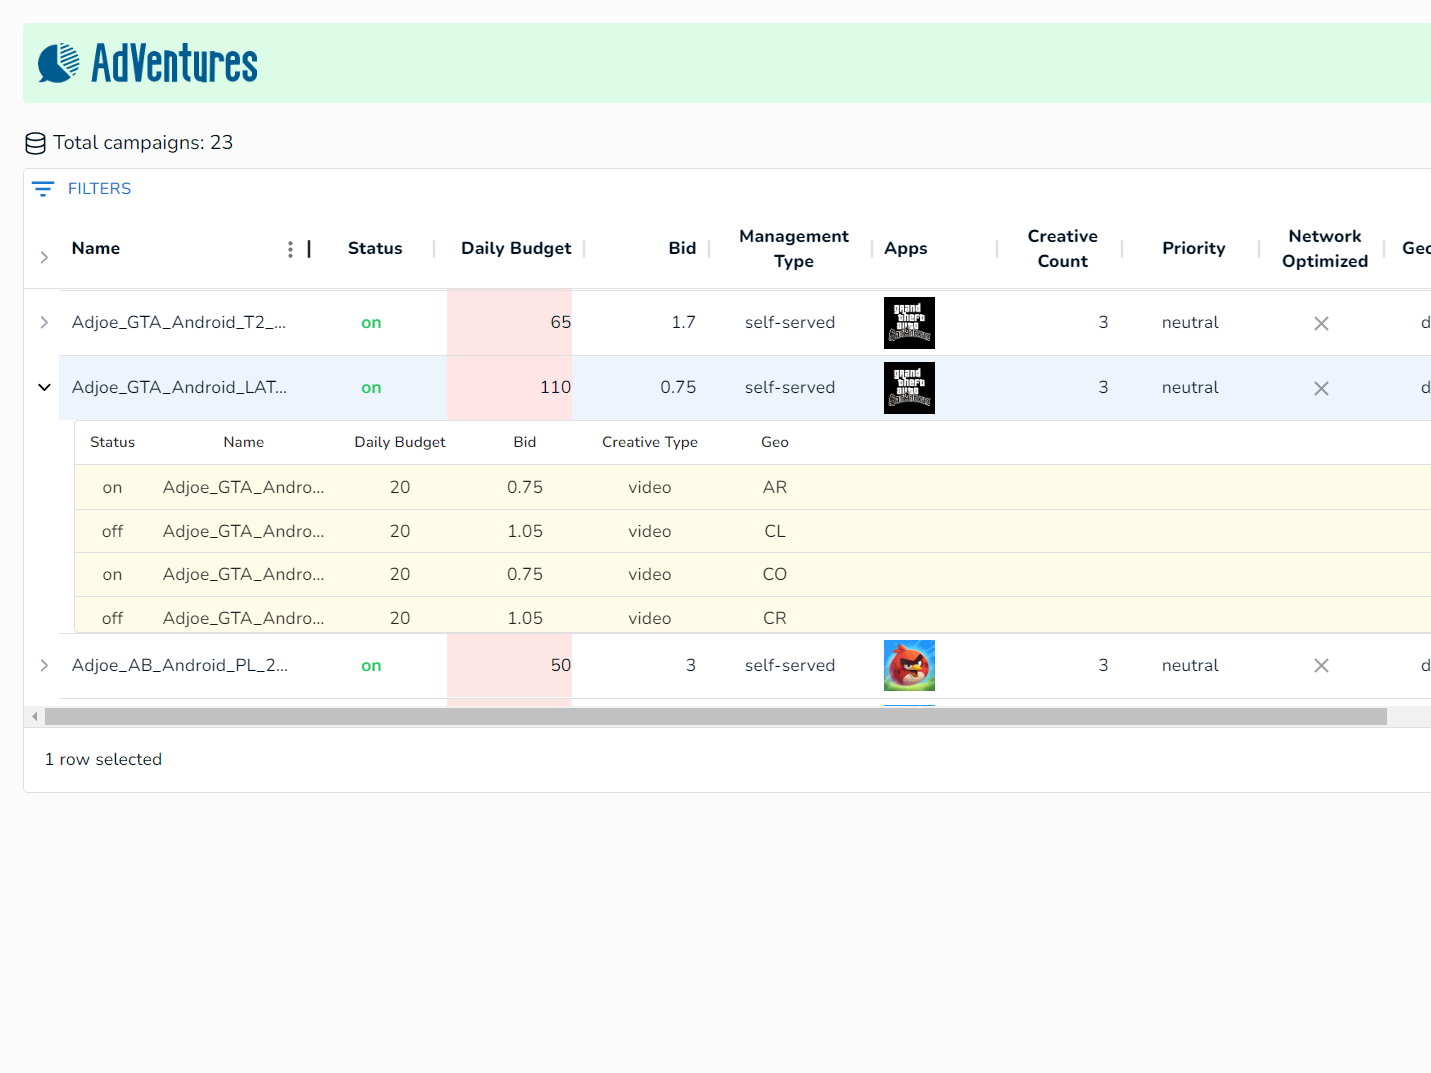
- Custom Table Features
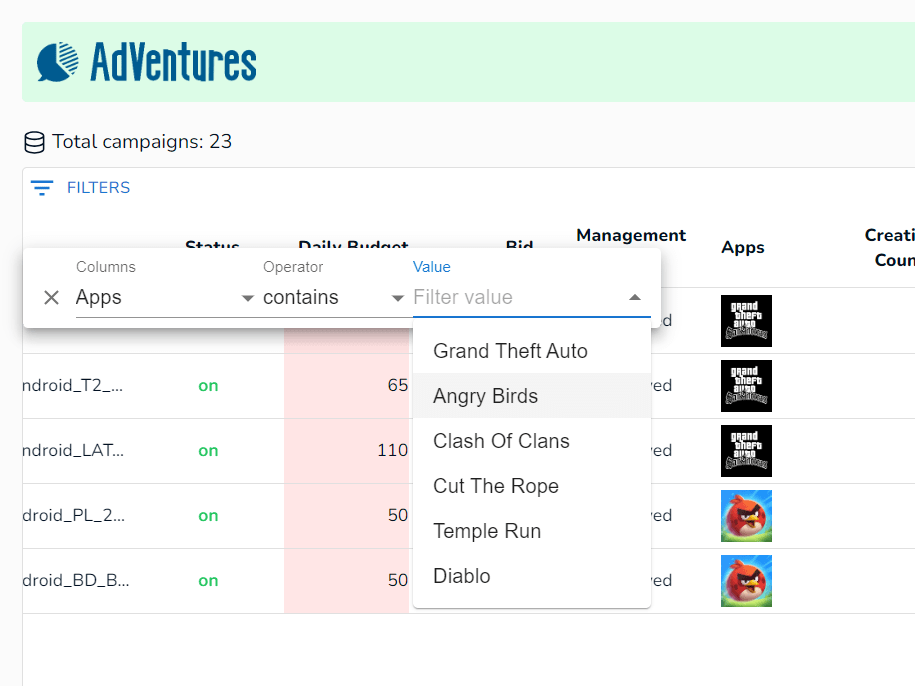
Extended MUI Data Grid with tree view, app icons, and sorting/filtering for enhanced data presentation. - Data Visualization
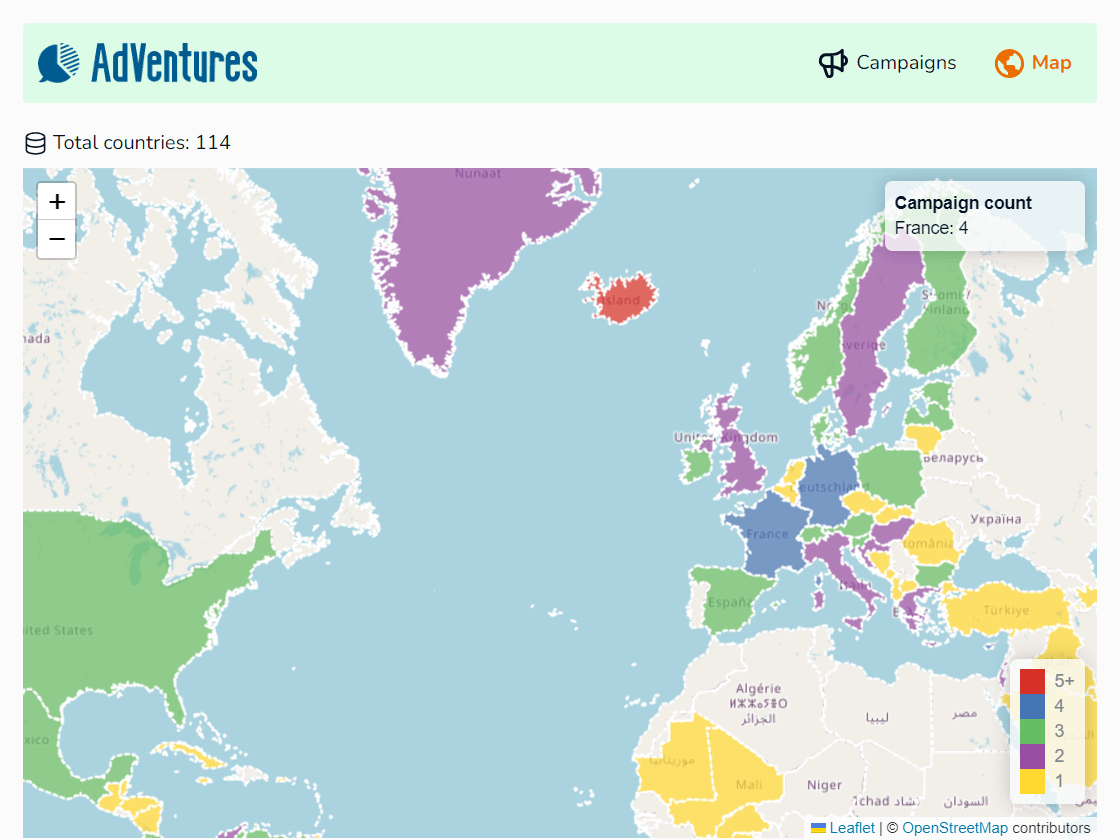
Visualized daily budgets with proportional indicators and displayed geographic data on interactive maps using Leaflet. - Mock API Implementation
Designed a simulated API to provide campaign and geographic data, enabling full front-end functionality without a real backend. - End-to-End Testing
Ensured functionality and reliability across browsers with Playwright automated tests.